MISP Galaxies and Clusters
The MISP galaxies and clusters are an easy way to add context to data. I’ve previously written an article “Creating a MISP Galaxy, 101” that describes how you can create your own galaxy and cluster.
Apart from the context, galaxies and clusters also allow you to describe relations between individual elements. These relations can for example be the synonyms (naming) for an APT group or the fact that a specific group uses a (MITRE ATT&CK) technique. They can also be used to describe similarities between different tools.
A visual representation of relations make it much more easier for human analysts to represent interactions between different elements (for example in reporting) but also allow to correlate and pivot to other relevant elements.
Visualise the galaxy relations
One of the tools that I discovered in the MISP galaxy repository is a script to create these visual representations, based on the galaxy/cluster JSON file but outside MISP. This allows you to
- Document the threat in MISP and have the contextual relations in the threat event;
- Create and re-use the same relation-graph in customer reports.
The Python script to create these graphs is graph.py. You can either create a graph for a specific UUID or create all graphs. You need to have Graphviz installed. On OSX this is all very straightforward.
1 | python3 -m misp-galaxy |
2 | source misp-galaxy/bin/activate |
3 | git clone https://github.com/MISP/misp-galaxy |
4 | pip install graphviz |
5 | brew install graphviz |
6 | cd misp-galaxy/tools |
7 | ./graph.py -u 2abe89de-46dd-4dae-ae22-b49a593aff54 |
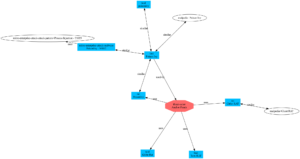
This will generate a graph for the ID 2abe89de-46dd-4dae-ae22-b49a593aff54, or the PoisonIvy RAT.
Eventually you end up with the graph

Conclusion
This post describes building graphs and visual relations between galaxies and clusters based on the MISP built-in information. Obviously you can do the same for your own threat research and maybe you can contribute back to the community?

